Creating an Incident
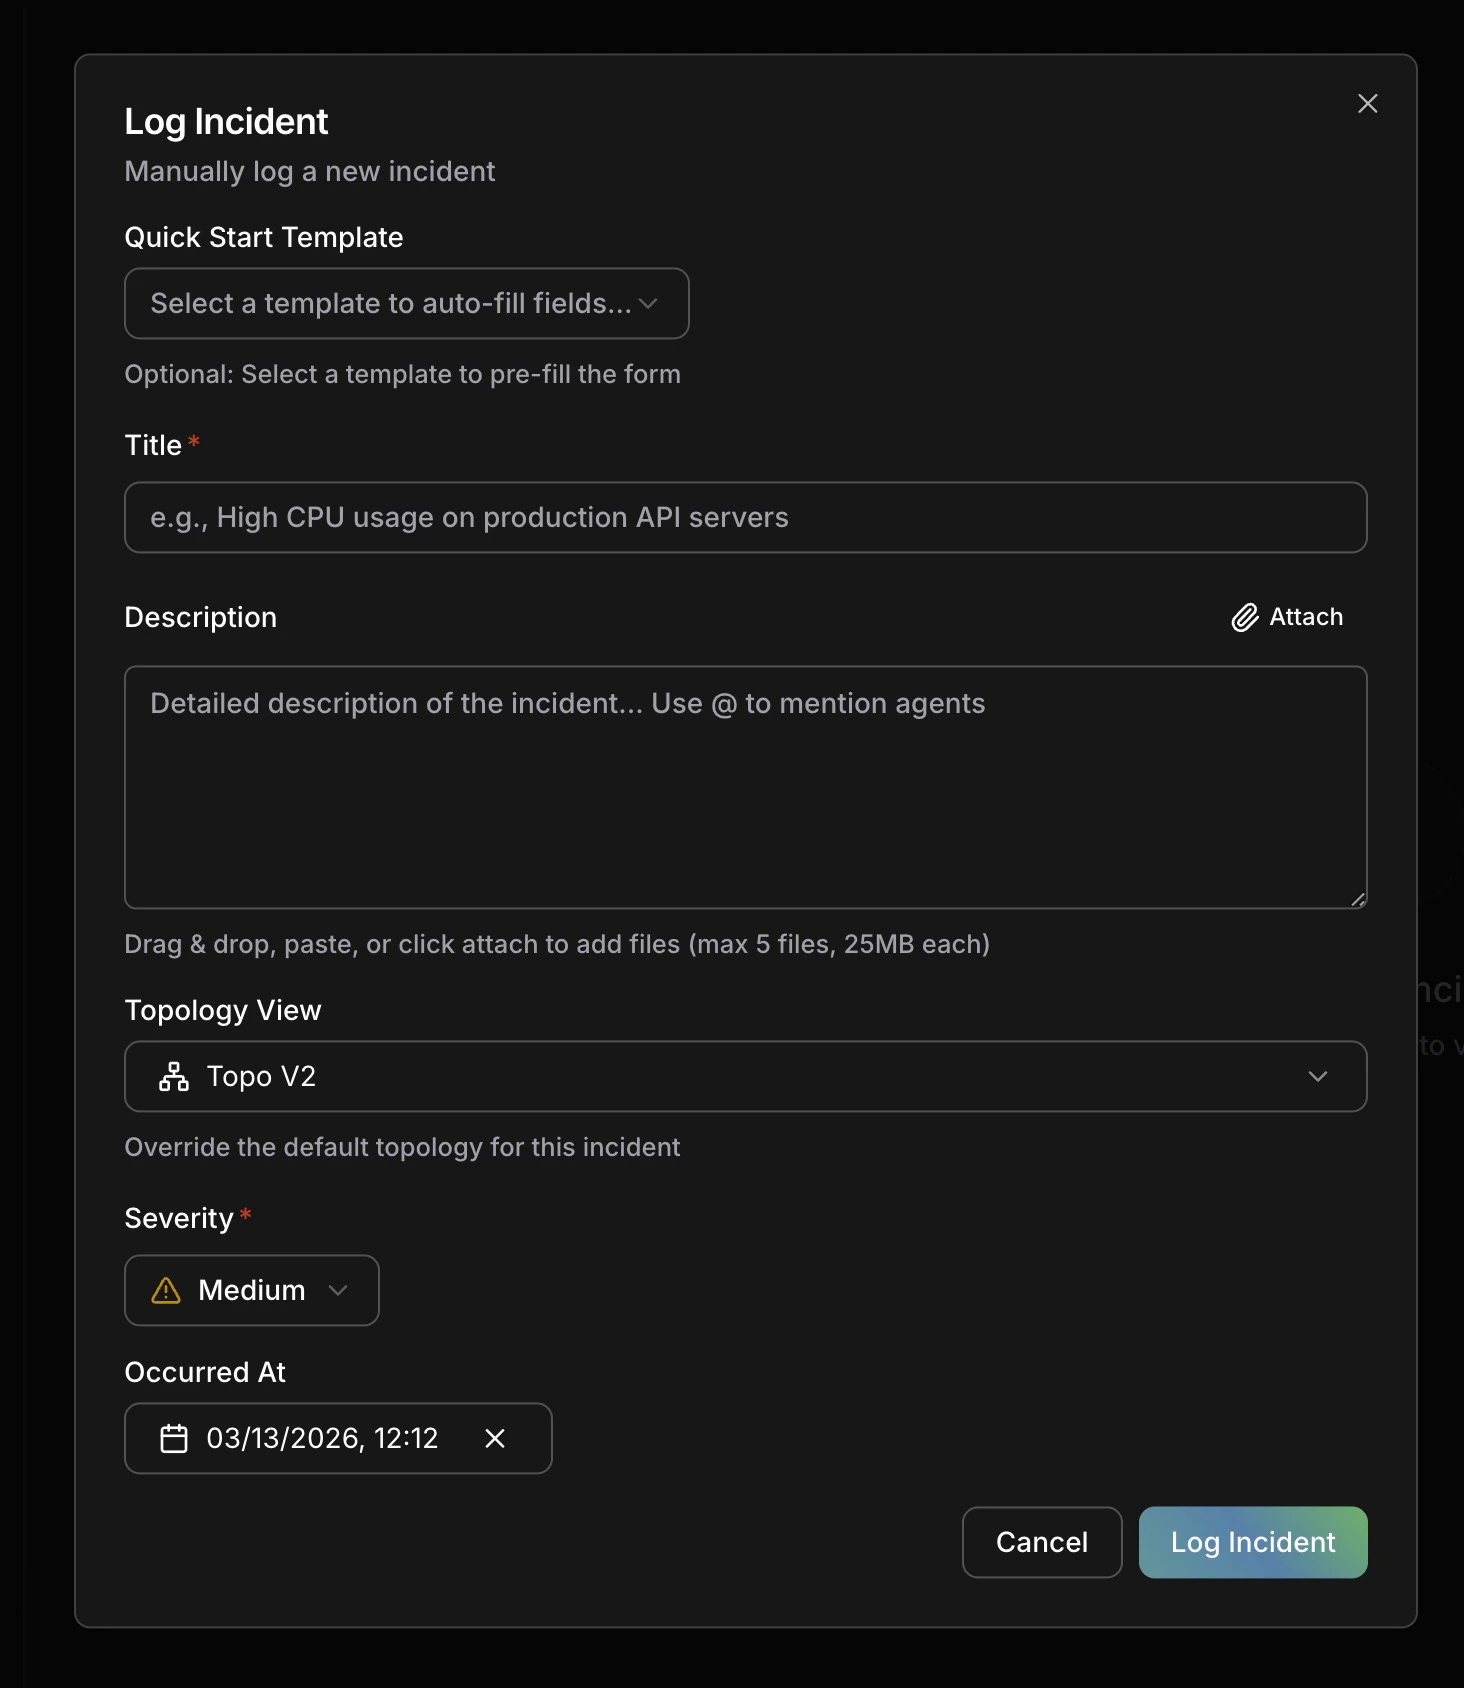
Manual incident creation form
Required Fields
Title- Concise summary of the incident (e.g., “API Gateway 503 errors in production”)
- Appears in incident list and notifications
- Used by AI agents to understand incident scope
- Detailed context about what’s happening
- Observable symptoms and customer impact
- Timeline of events if known
- Any initial troubleshooting steps already attempted
- Use
@to mention specific agents (e.g.,@alex,@tony) to direct the investigation
- Click the Attach button next to the description, or drag & drop files directly into the form
- You can also paste images from your clipboard
- Attach screenshots, log files, error exports, or any supporting evidence
- Limits: up to 5 files, 25MB each
- Attached files are available to AI agents during investigation, giving them additional context to identify root causes faster
Critical: Complete service outage, data loss, or security breachHigh: Major functionality degraded, significant customer impactMedium: Partial functionality affected, workarounds availableLow: Minor issues, minimal customer impact
- Select from your topology map
- Helps RCA agents prioritize investigation scope
- Determines which specialized agents are activated
- Can be updated after investigation reveals additional impact
What Happens Next
Once saved, CloudThinker automatically:- Queues RCA Task: AI investigation begins in background within seconds
- Activates Agents: Specialized agents (Alex, Tony, Kai, Oliver) analyze your infrastructure based on affected services
- Builds Timeline: Investigation findings logged in real-time with hypothesis tracking
- Identifies Root Cause: Hypothesis-driven analysis with structured evidence chains
- Suggests Remediation: Actionable steps prioritized by impact and urgency
When to Use Manual vs Webhook Creation
| Scenario | Recommended Method |
|---|---|
| Monitoring platform alerts | Webhook Integrations |
| Customer-reported issues | Manual Logging |
| Testing RCA workflow | Manual Logging |
| Ad-hoc investigations | Manual Logging |
| Proactive health checks | Manual Logging |
| Observed degradation (pre-alert) | Manual Logging |
Next Steps
Root Cause Analysis
Understand how AI agents investigate incidents and build evidence chains
Webhook Integrations
Automate incident creation from PagerDuty, Datadog, Prometheus, and 11+ platforms