

How it works
- Ask — send a prompt using the CloudThinker Language syntax:
@agent #tool instruction. - Gather — the agent queries live data across your connections: Cost Explorer, CloudWatch, databases, and more.
- Generate — the agent assembles an Artifact with charts, tables, and a written summary.
- Save, download, or rerun — save generated files to Files, download supported Artifacts as PDFs from their PDF URLs, or schedule the prompt to run again.
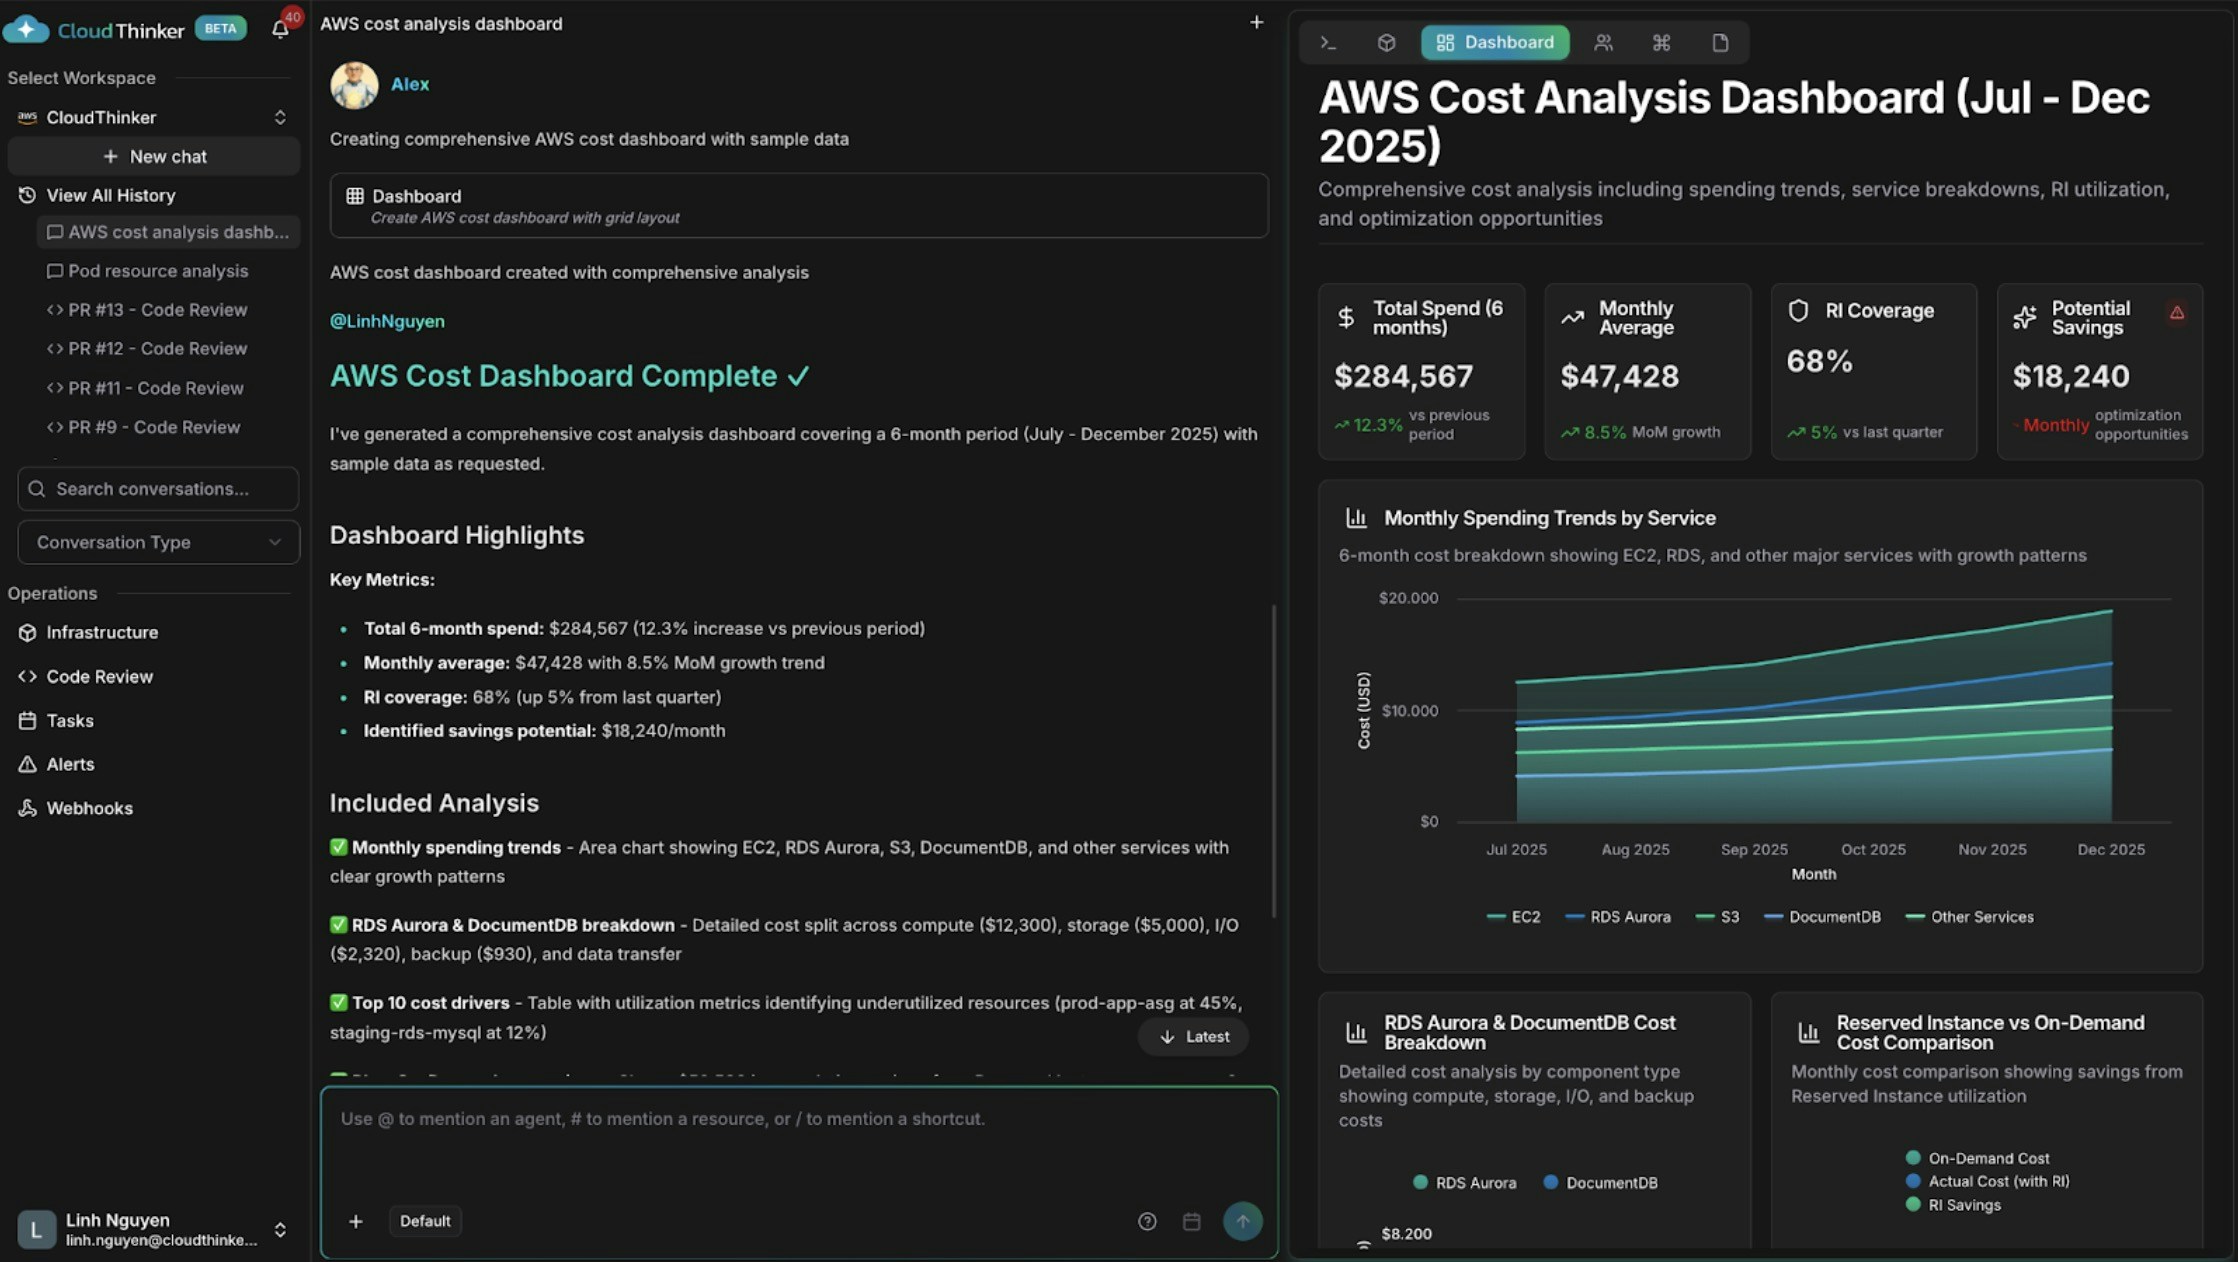
AWS cost dashboard with spending trends and cost drivers
What you can do
Artifact types
Charts are components of dashboards and reports. A standalone
#visualize chart renders directly in the conversation, not as a separate artifact type.
Share an artifact
Any artifact can become a public link that opens without sign-in: click the share icon on the artifact’s card or preview, then Create share link. The gallery counts how many items are shared and can filter to shared items; revoking a link cuts off access immediately. Sharing covers what viewers see and the role required.Example prompts
Start with a one-line request — agents pick sensible defaults for scope and time range:Cost analysis dashboard
Add structure to the instruction when you need specific breakdowns:Cross-domain dashboard
Ask Anna to correlate data that lives in different systems: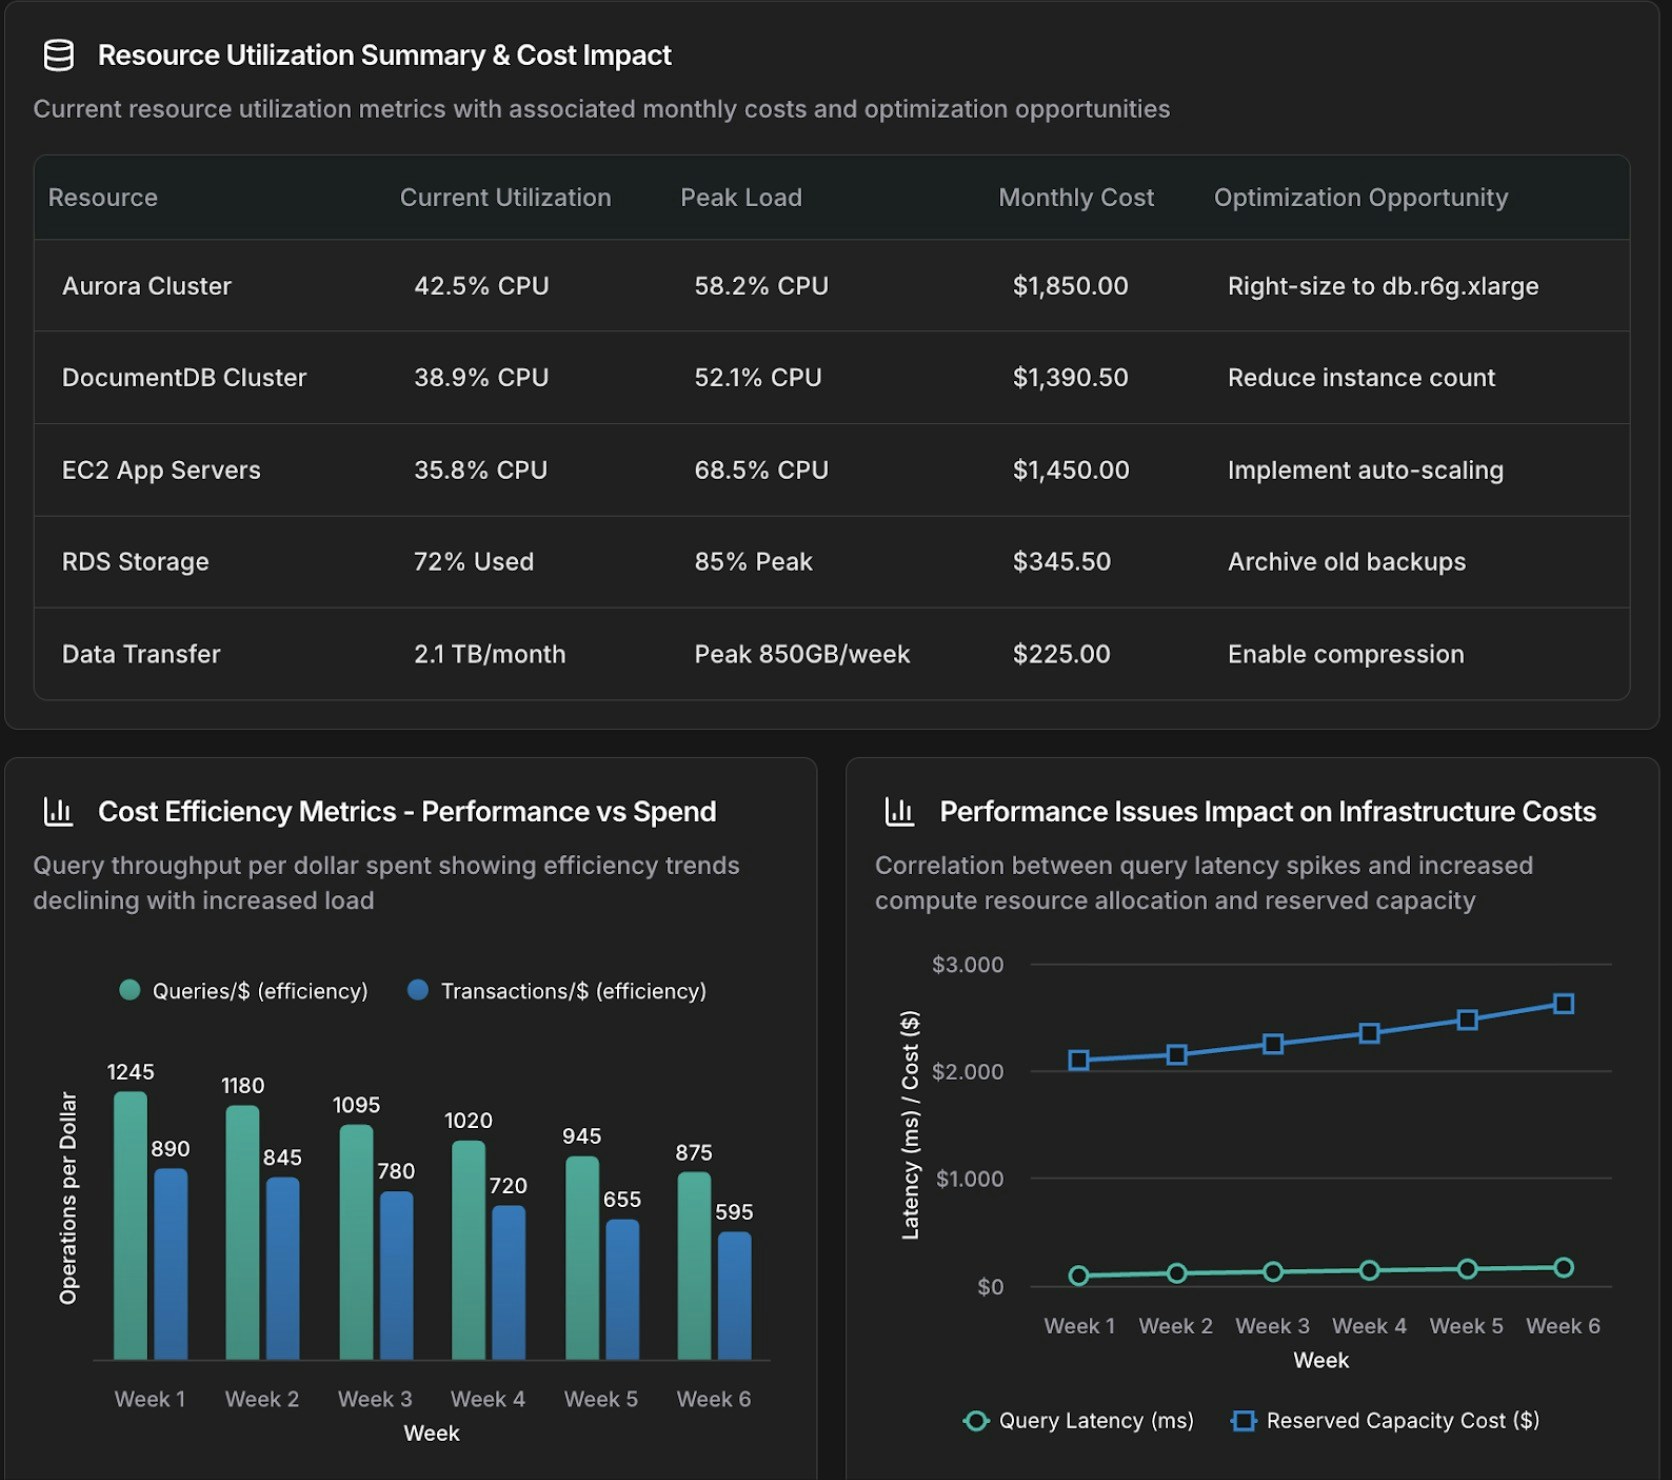
Database and infrastructure correlation dashboard
Charts in dashboards and reports
Ask for a chart as part of a dashboard or report: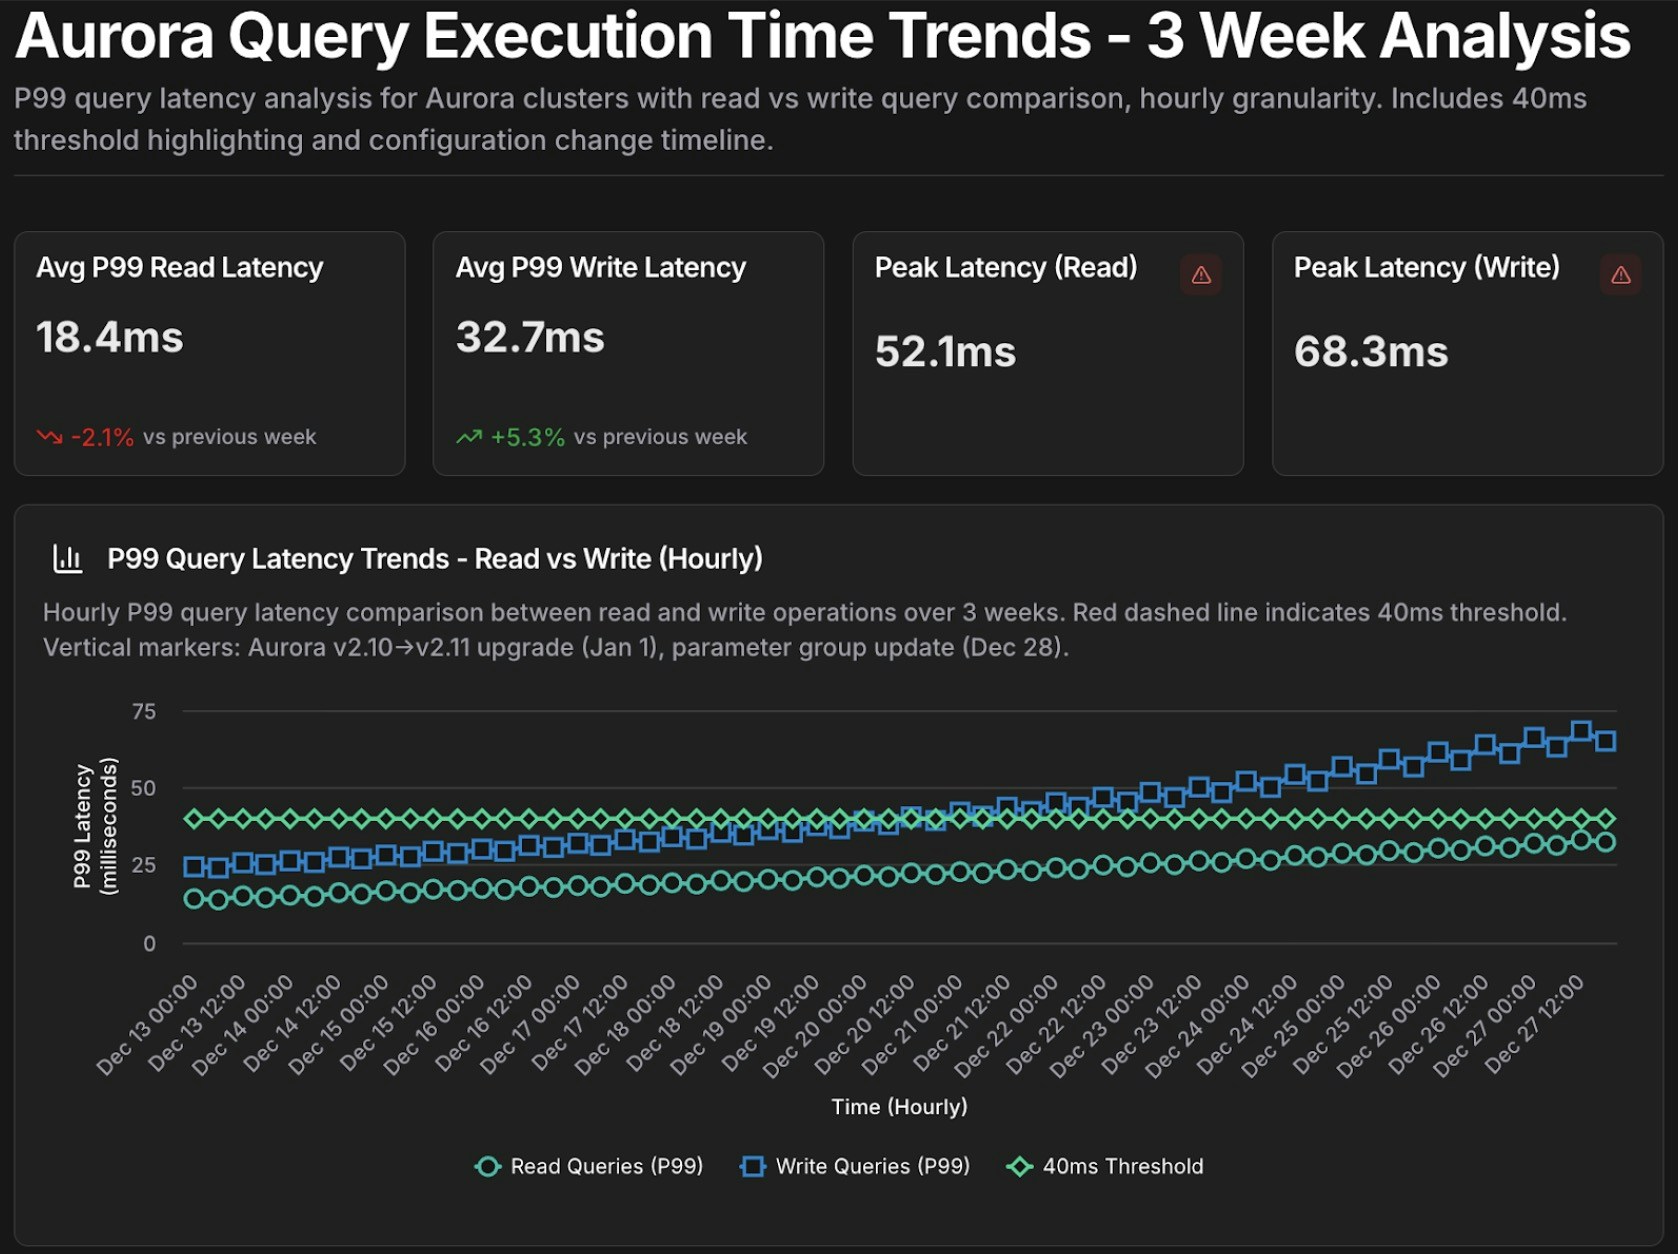
Aurora query performance time-series chart
Reusable prompt patterns
Keep parameterized prompts wherever your team stores runbooks, and fill in the placeholders before each run. The{placeholder} braces are a writing convention, not product syntax — replace them with real values before you send the prompt:
cluster_id=production-aurora-cluster, time_period="past 7 days", comparison_period="previous 30 days", and latency_threshold=200.
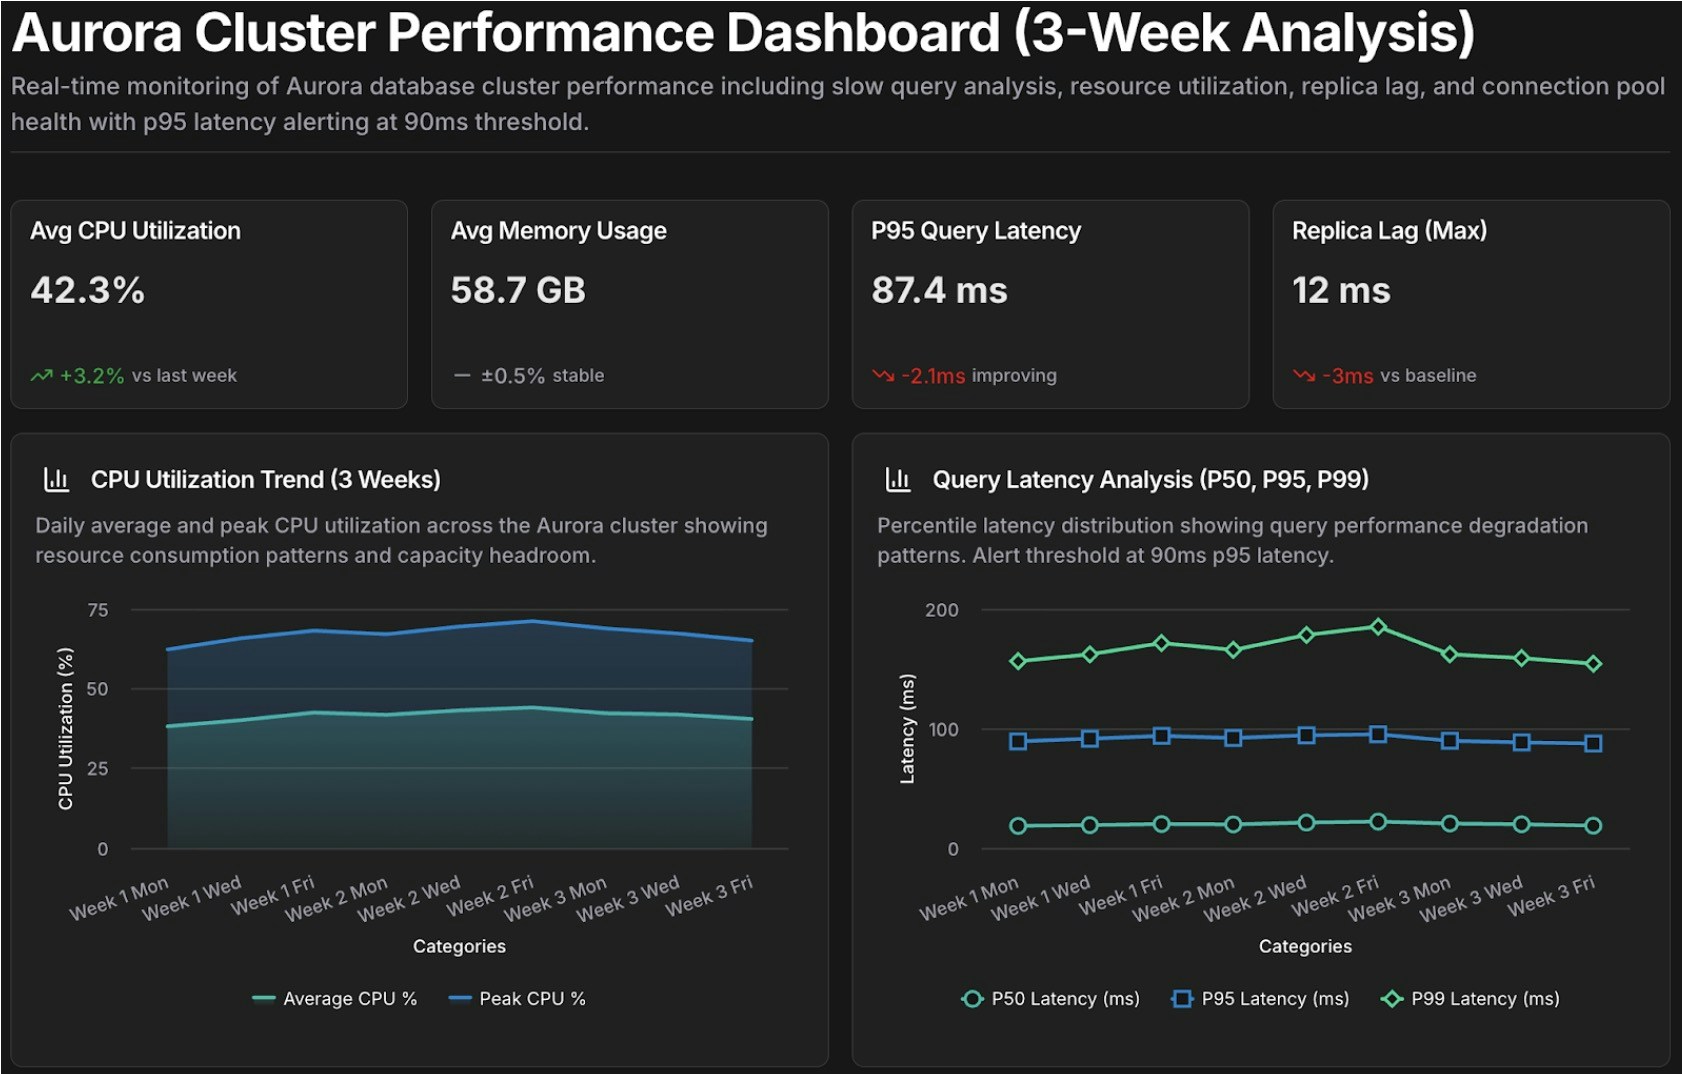
Performance review dashboard template
Related
Spend and forecast
Dive deeper into spend trends, forecasts, and cost attribution analysis
Resolve
Correlate evidence and dependencies during root cause analysis
CloudThinker Language
Master the full @agent #tool syntax for building effective prompts
Automations
Rerun prompts in new scheduled conversations