# followed by the capability name to specify the output format.
The Problem With Fragmented Output Tools
Cloud operations generate insights — but getting those insights into the right format for the right audience normally requires separate tools: Grafana for dashboards, Confluence for documentation, Google Slides for board presentations, JIRA for recommendation tracking, PagerDuty for alerts. Each tool requires separate setup, separate access management, and context switching. The result: insights from AI analysis get copy-pasted into documents, manually formatted for presentations, or never leave the terminal. High-value findings don’t reach decision-makers. CloudThinker Capabilities bring all output formats into the same conversational interface — so the analysis and the deliverable are created in one step.How It Compares
| Output Need | Traditional Approach | CloudThinker |
|---|---|---|
| Monitoring dashboard | Configure Grafana panels, write PromQL queries | @alex #dashboard AWS cost by service |
| Executive report | Write document manually, pull data from 5 tools | @anna #report quarterly infrastructure review |
| Recommendations | Engineer analyzes data, writes recommendations doc | @tony #recommend index optimizations prioritized by impact |
| Alerts | Configure PagerDuty rules, write alert conditions | @kai #alert when pod OOMKilled in production |
| Board presentation | Build slides manually with exported charts | @anna #slide cloud transformation progress Q4 |
Available Capabilities
| Capability | Description | Example |
|---|---|---|
#dashboard | Interactive visualizations and metrics | @alex #dashboard AWS cost trends |
#report | Detailed analysis documents | @oliver #report security assessment |
#slide | Presentation-ready slides | @anna #slide quarterly review |
#search | Search and retrieve information | @alex #search unused EC2 instances |
#recommend | Actionable recommendations | @tony #recommend index optimizations |
#alert | Monitoring notifications | @kai #alert when CPU >80% |
#chart | Data visualizations | @alex #chart spending by service |
#kb | Knowledge base search | @alex #kb cost optimization policies |
#dashboard
Create interactive dashboards with real-time metrics and visualizations.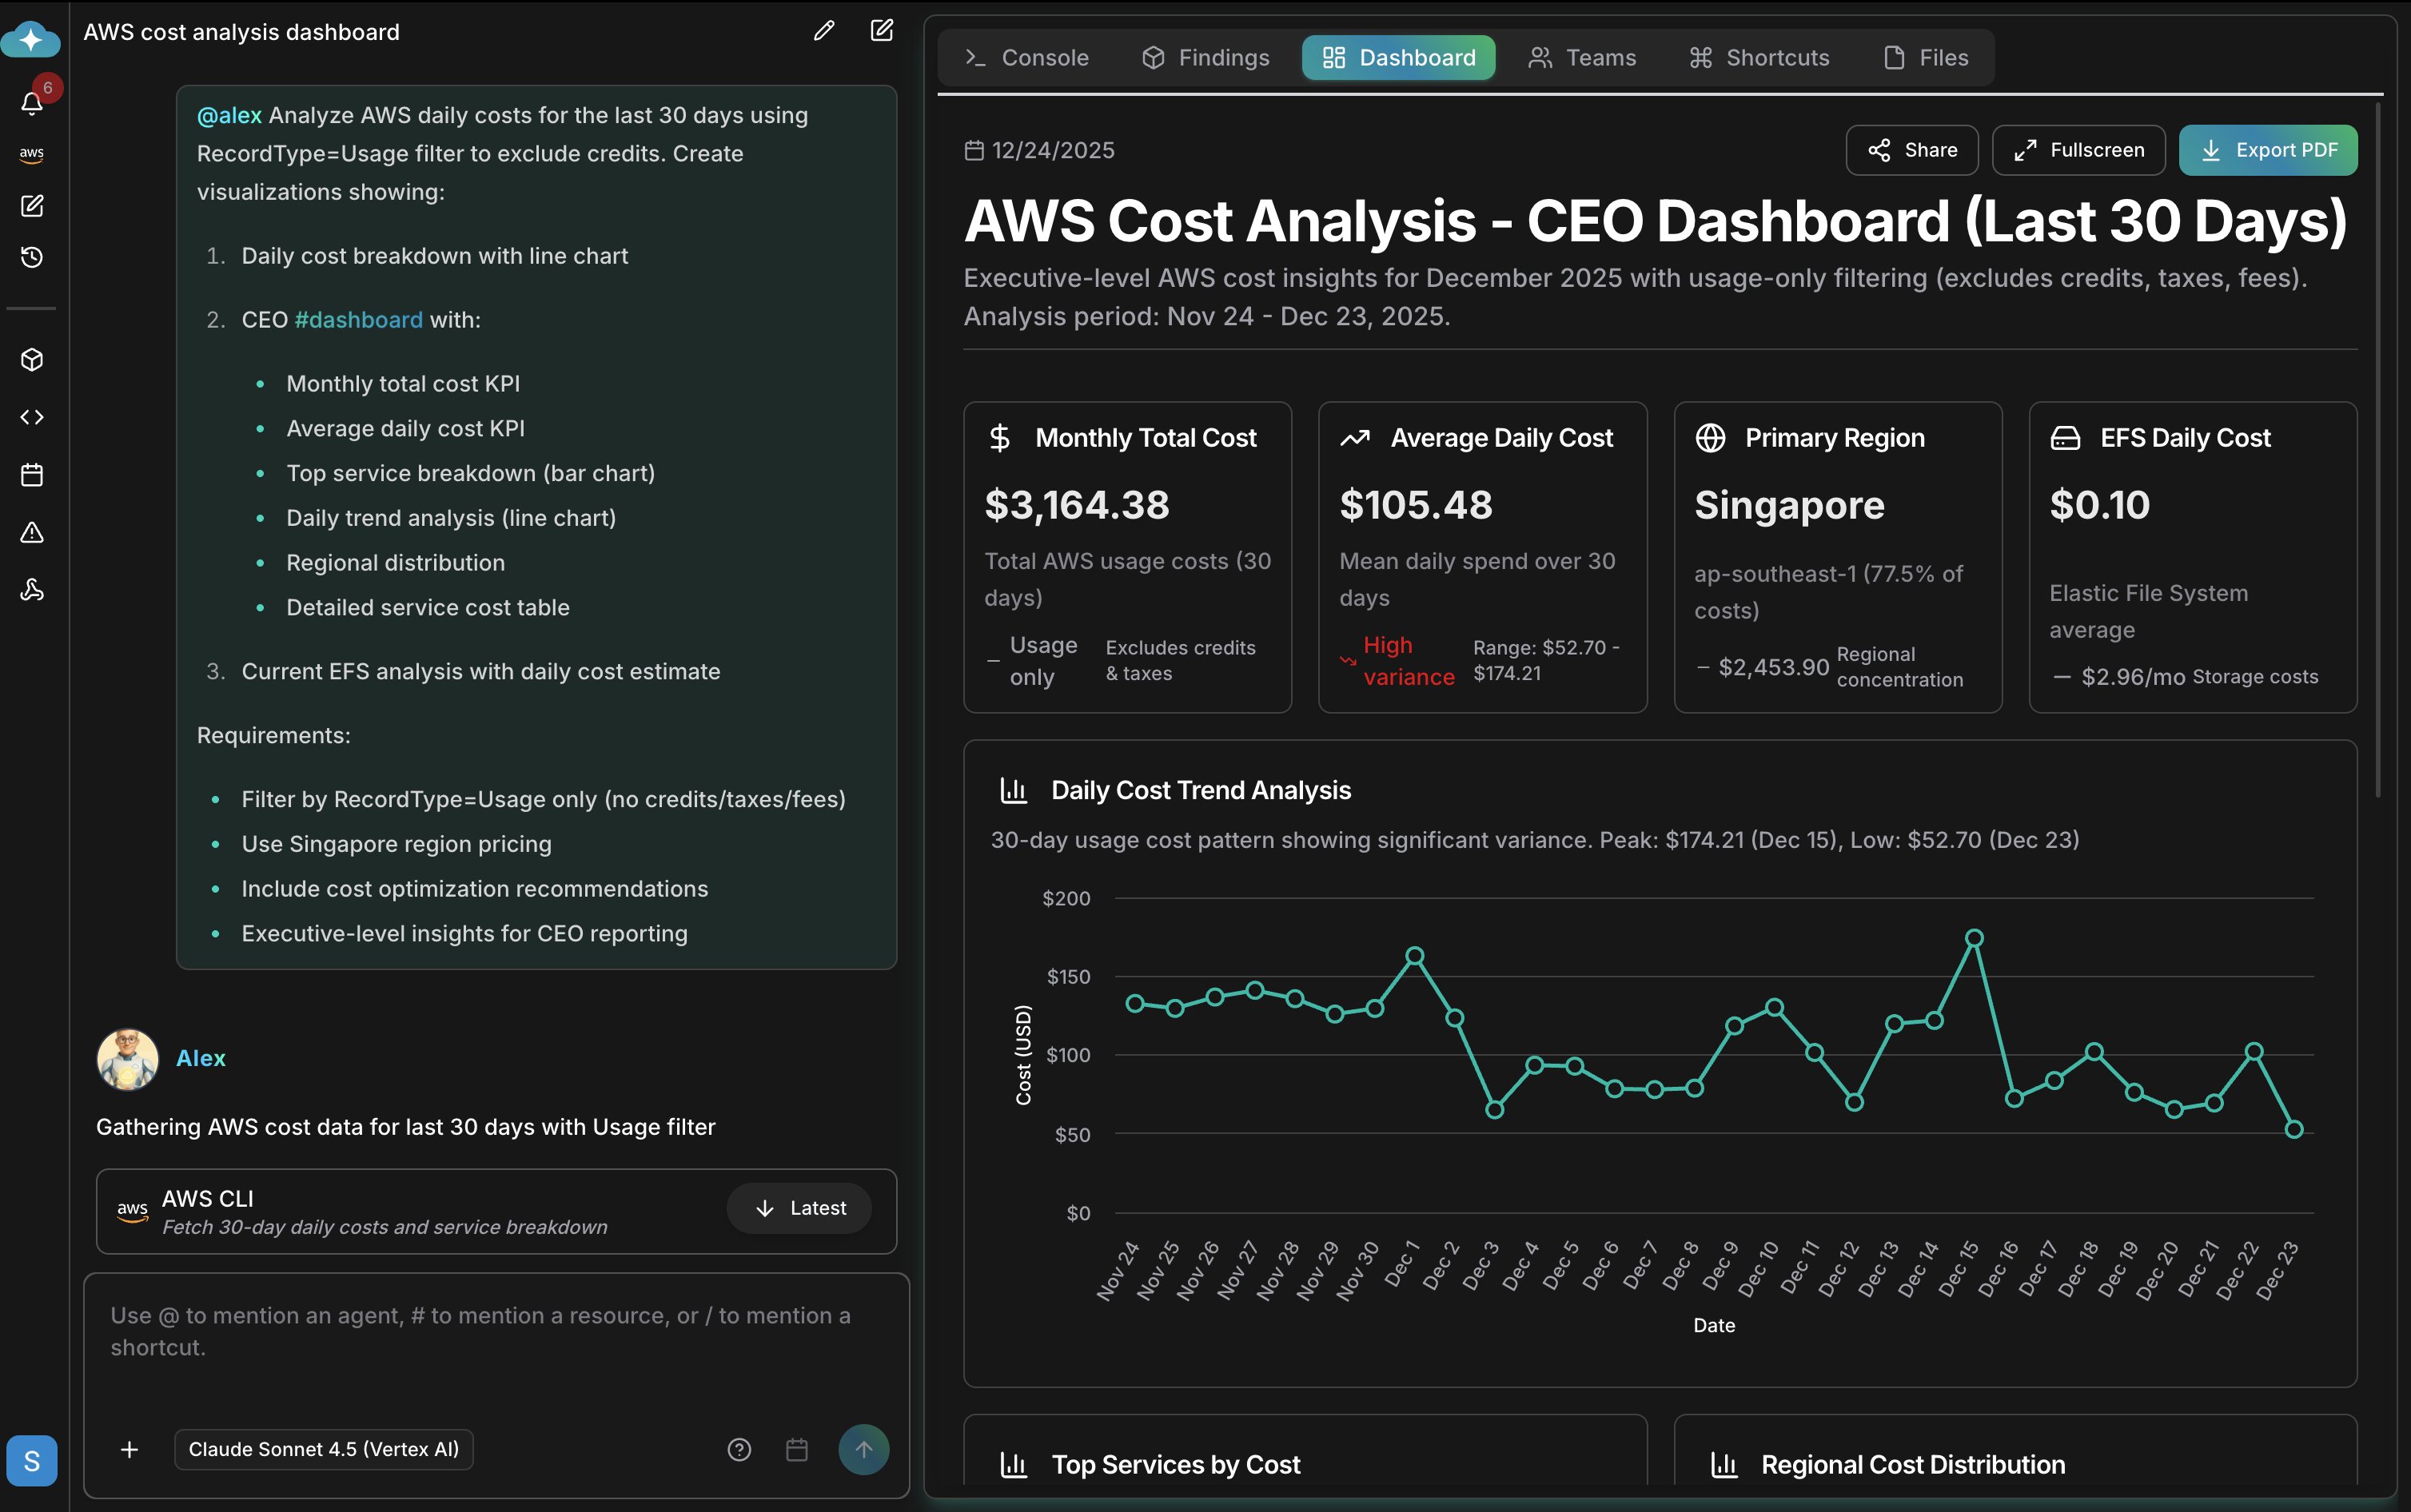
- Interactive charts and graphs
- Real-time metrics
- Filterable data views
- Export to PDF
- Fullscreen mode
#report
Generate comprehensive analysis documents with findings and recommendations. Example prompts:- Executive summary
- Detailed findings
- Prioritized recommendations
- Supporting data and charts
- Exportable format
#slide
Create presentation-ready slides for meetings and reviews. Example prompts:- Professional formatting
- Key metrics highlighted
- Visual charts and graphs
- Ready for presentations
#search
Search and retrieve specific information from your infrastructure. Example prompts:#recommend
Get actionable recommendations with prioritization. Example prompts:- Prioritized by impact
- Effort estimates
- Implementation steps
- Risk assessment
#alert
Set up monitoring alerts and notifications. Example prompts:#chart
Create data visualizations and charts. Example prompts:#kb
Search your organization’s knowledge base. Example prompts:Combining Capabilities
You can combine capabilities with detailed instructions:What’s Next
CloudThinker Language
Complete
@agent #tool syntax reference and advanced prompt patternsOperations Hub
325+ pre-built operations using these capabilities — ready to run
Recurring Tasks
Schedule capabilities to run automatically — daily reports, weekly audits
Agents
Understand which capabilities each agent specializes in